
Spaghetti Diagram: Reducing Space & Motion Waste in the Lab
Over time, your laboratory can become inefficient due to the lack of thought process behind the positioning of equipment and workstations. Inefficiencies often occur over long periods of time with the gradual growth of a laboratory. Substantial amounts of motion waste can be eliminated when binging your laboratory in accordance to lean principles resulting in greater efficiently, output and ROI.
When improving, building or refurbishing a new laboratory, the team at Modulab, highly recommend using a spaghetti diagram to assist you with maximising your ROI and minimise your motion waste.
A spaghetti diagram is a simple way to assist you to visually identifying motion waste in your laboratory by looking at the movement of people over a period of time or cycles. It clearly outlines where a person is walking most frequently as well as distance walked. As a result, the equipment can be relocated or duplicated to reduce walking distance/downtime.
Example of Spaghetti Diagrams
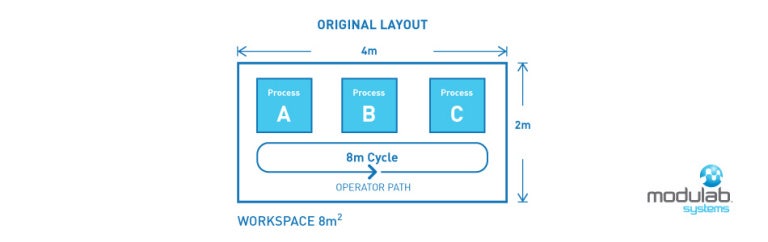
- Current walking distance per Cycle 8.0 metres
- Current workspace 8m2

- Improved walking distance of 3.0 metres
- Improved workspace 6.0m2
In the current and improved examples in diagram 1 and 2, you can see the clear space and motion benefits with the improved layout. There is a 4.0 metre saving per cycle and a 2m2 saving in space.
- Motion saving per cycle = 63% saving
- Space Saving = 25%
Calculating The Motion Savings
If there were 50 cycles per day for 230 working days a year at $70.00 per hour, calculate the savings in the improved layout in diagram 2.
The walking saved per cycle is 5.0 metres (Current distance – improved distance) This is equivalent to 57.5km motions saving per year. ((Saved distance x cycles x working days)/1000m = km saved). If we walk at an average speed of 2km per hour, this is a 29-hour saving per year (No. km per year/speed (km) = hours saved). If every hour is valued at $70.00, this is a $2030.00 annual saving in motion alone. (total number of hours x $70.00)
- Travel: 57.5km Saved
- Time: 29 Hours Saved
- Money: $2030 Saved
Calculating The Space Usage Savings
If rent was $2.00 per square metre 365 days of the year, calculate the savings in the improved space in diagram 2.
Current space of the laboratory is 8 metres squared (4m x 2m) the improved space is 6 metres squared (3m x 2m). This is a total saving of 2 meters squared (Current Space – Improved Space).
To calculate the total space savings per year. (Space savings x rent per metre/ 365 = $ Savings per year) Total rent saved for the 2 metres per year is $1460.00.
- Money: $1460.00 Rent Savings
How Do I Justify My Project?
The total savings based on the time and motion calculations are $2030 + 1460 = $3490.00 (Time + Rental Savings)
It is a great idea to present your calculations to help you understand and quantify the savings. This can also assist with the approval process as well. If the layout change cost $500.00 the payback period will be 1.7 months ((Cost/ Savings) x 12) and the ROI (Return on investment) will be 598% ((Savings – Cost) / Cost x 100)
- 7 months payback period
- 598% ROI
Summary
This example improvement diagram would offer the company total annual savings of $3490.00 with an ROI of 598% with 1.7-month payback period. The most important thing to look at after calculations are two things, ROI (Savings per $1 spent) and the payback period (Time to recover the investment) Clearly communicating calculations and final savings will greatly assist you and your team with decisions when reducing waste, refurbishing or relocating a laboratory space. Ask the team at Modulab to assist you with your project.